
Technical articles · October 29, 2026
Detecting fatigue without interrupting work: the role of parasympathetic activity
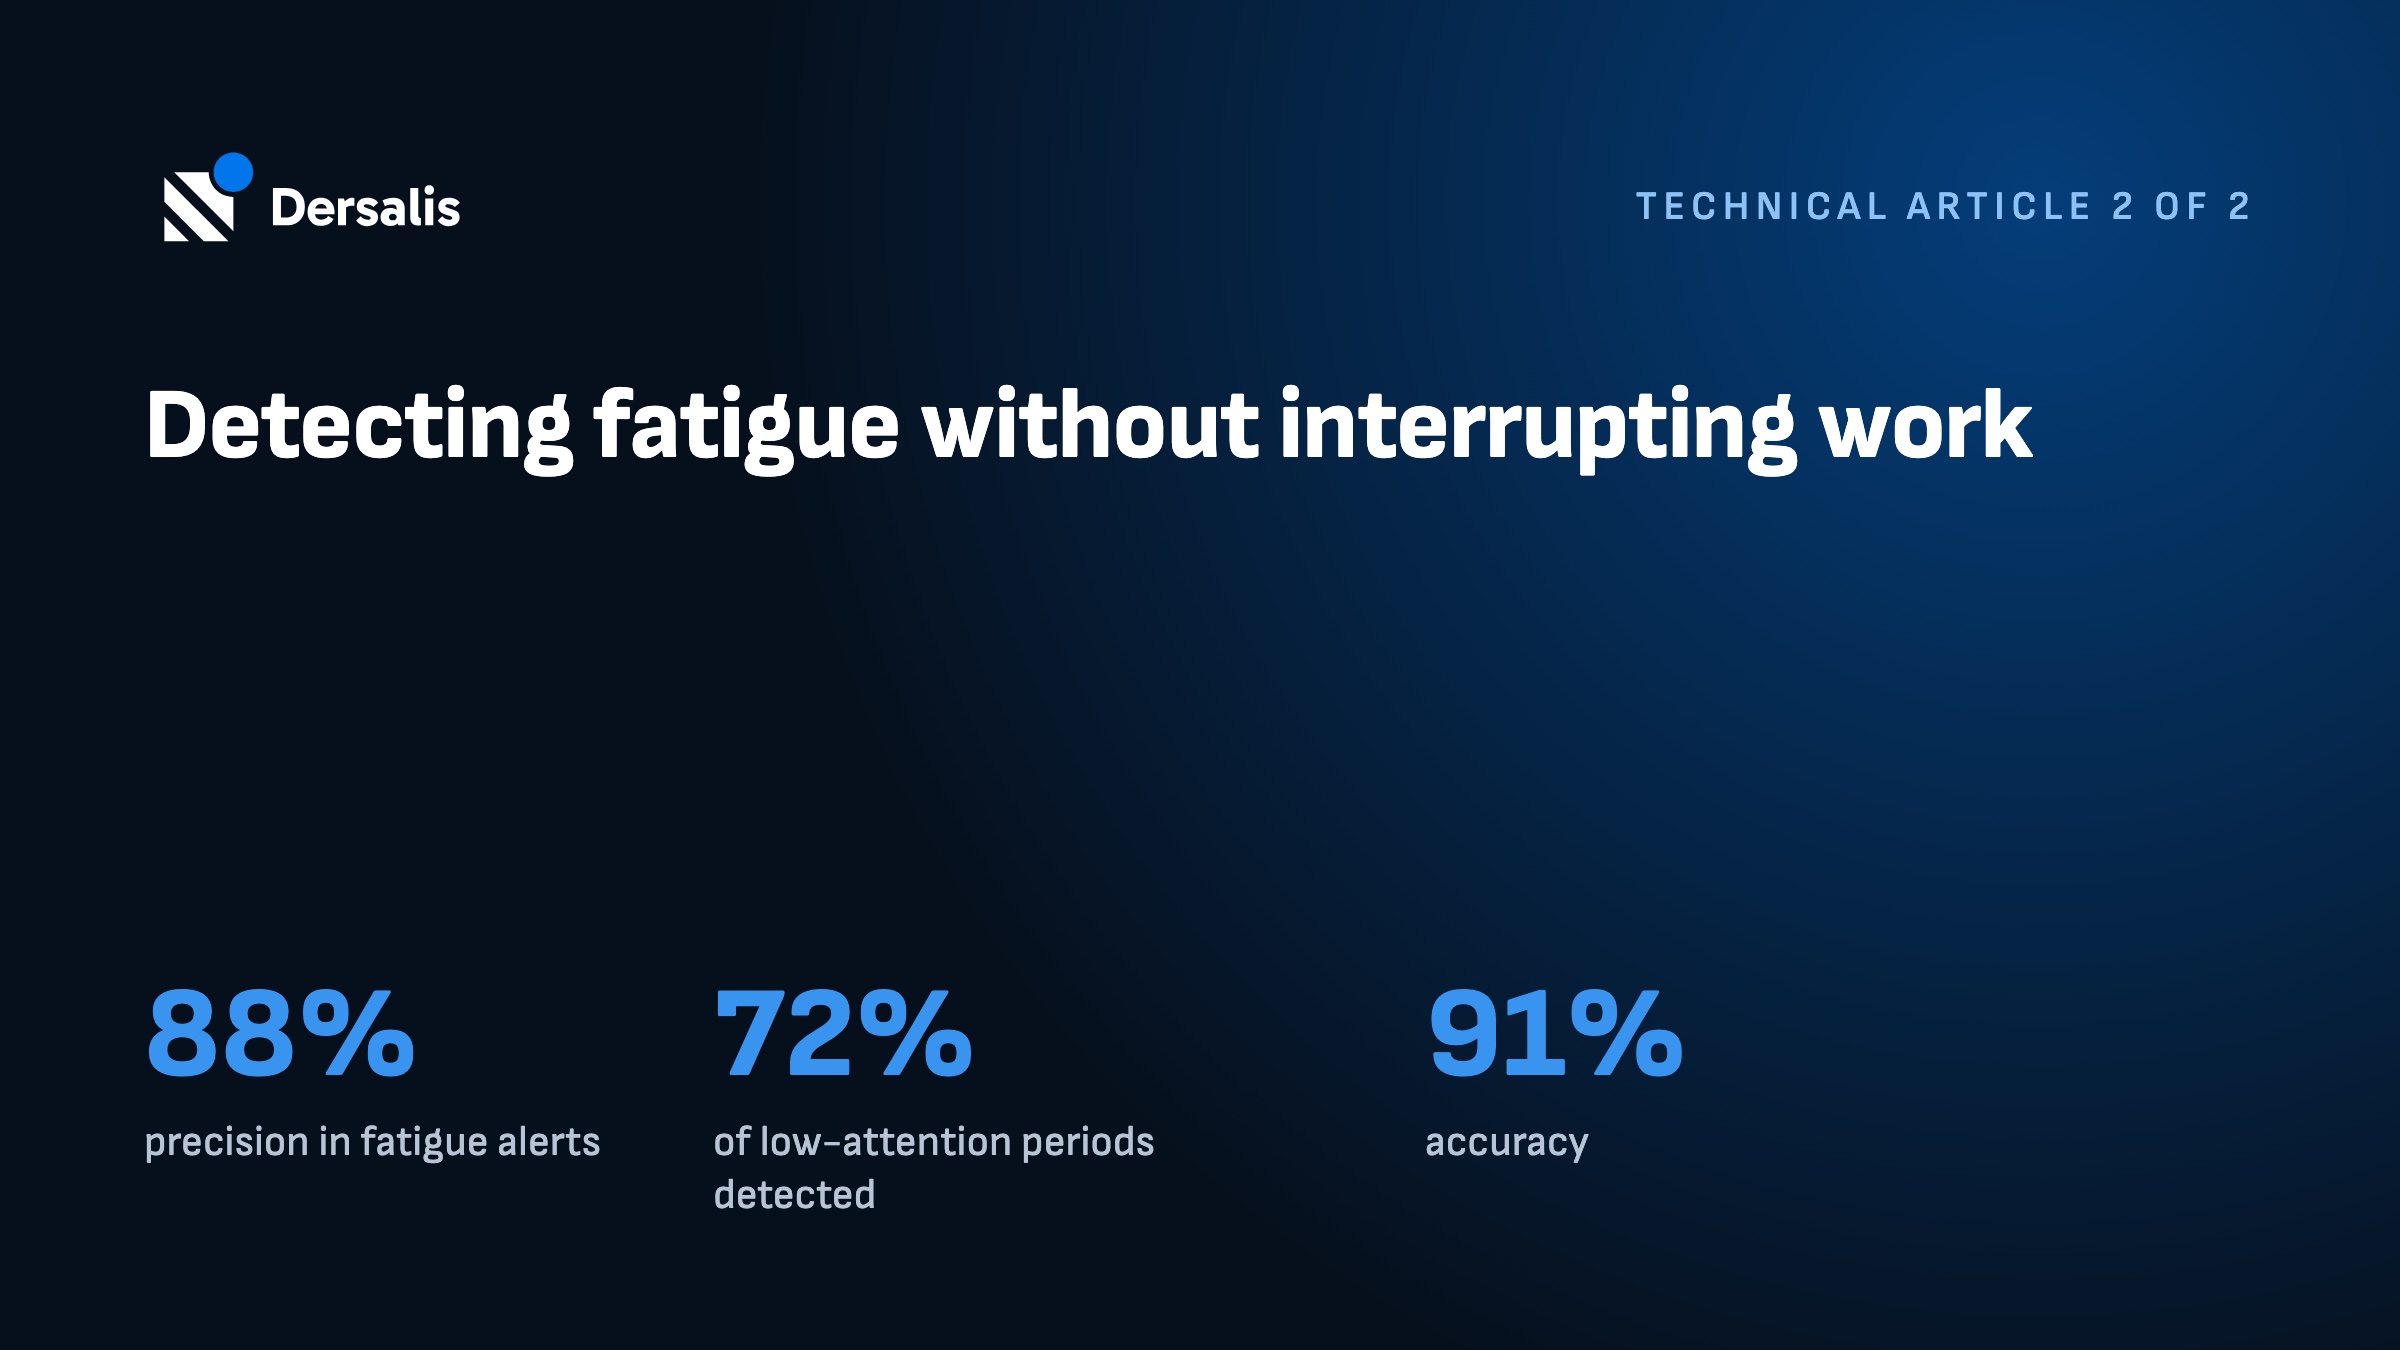
Questionnaires and attention tests depend on the worker’s answer and interrupt the activity. Dersalis developed a model that identifies fatigue from the predominance of parasympathetic activity, measured through heart rate variability by a wrist sensor. Over five industrial logistics shifts at Ocyan’s pipe shop in Macaé, the model was right in 88% of the alerts it issued and found 72% of the periods of low attention, with an overall accuracy of 91%.
Download the full article as a PDF: Detecting fatigue without interrupting work: the role of parasympathetic activity
From questionnaire to body
In the first article in this series, we showed that on the ODN-1 rig, 83% of self-assessments showed little or no sleepiness while 57% of attention tests showed low performance. Psychometric tests are important tools, but answers can diverge from the biological response, because each person adopts strategies to cope with the test situation (Armario et al., 2020). On top of that, every test requires stopping the task.
The next question was: is it possible to identify fatigue continuously, without depending on the worker’s answer and without interrupting work? The literature suggests it is. Instead of one-off fitness-for-duty measurements, continuous monitoring of vital data makes it possible to follow how fatigue evolves over the shift (Sparrow et al., 2019).
What heart rate variability reveals
The interval between one heartbeat and the next is not fixed. This variation, called heart rate variability (HRV), reflects the balance between the two branches of the autonomic nervous system: the sympathetic branch, which prepares the body for action, and the parasympathetic branch, which leads to rest and recovery. That is why HRV is considered a promising marker of sleepiness, fatigue and stress (Burlacu et al., 2021), and recent studies show distinct patterns between fatigued and non-fatigued states (Gao et al., 2022).
The metrics used by Dersalis are among those recommended by the Task Force of the European Society of Cardiology (1996), all in the time domain (Shaffer and Ginsberg, 2017):
- RMSSD: the square root of the mean of squared differences between consecutive intervals, linked mainly to parasympathetic activity;
- SDNN: the standard deviation of intervals between heartbeats, which expresses overall variability;
- pNN50: the percentage of consecutive intervals that differ by more than 50 ms.
During active work, a prolonged parasympathetic predominance is a sign that the body is shifting into rest mode while the person still needs to be alert. This state is associated with more lapses, lower sustained attention and a higher likelihood of error.
How the model works
The wrist sensor uses photoplethysmography (PPG), an optical reading of blood flow, and an accelerometer. From these signals, the model calculates heart rate and HRV metrics over short windows and applies a decision tree to identify when parasympathetic activity predominates.
A key concern was not to confuse fatigue with rest. The reference ranges start from normal values in the literature, but were adjusted for a working population and take movement into account: the same reading means something different for someone standing still and for someone carrying material. These ranges are not fixed. Because metabolism and resilience vary between people and between operations, thresholds can be configured per operation.
When the model identifies fatigue, the first person to be notified is the worker, so they can take a countermeasure (a break, hydration, stretching, switching tasks). If the condition persists, the supervisor also receives the alert and the two can agree on an action. No questionnaire has to be answered and no task has to be interrupted for the assessment to happen.
Field validation
The model was applied at Ocyan’s pipe shop in Macaé, Rio de Janeiro, with industrial logistics workers on morning, afternoon and night shifts. Five complete shifts were analyzed, divided into two-minute windows: 830 windows in total, about 28 hours of work.
To check whether each alert was correct, every window was labeled based on sleepiness tests and reports taken during the same period, indicating whether or not the worker’s sustained attention was reduced. The model’s outputs were then compared with these labels.
A closer look at one shift
In the first case, a logistics worker started a 12-hour shift at 7 p.m. Shortly after midnight, the first physiological signs of fatigue appeared, and the model flagged three periods of higher risk:
- from 12:45 a.m. to 1:30 a.m., after more than five hours of work, when heart rate began to drop;
- from 3:20 a.m. to 3:50 a.m., with a clear predominance of parasympathetic activity;
- from 4:00 a.m. to 4:30 a.m., the most critical period, with heart rate at its lowest of the night.

The worker was not asleep: the accelerometer showed movement consistent with light effort. In each period, they received alerts to take countermeasures. When these did not work or were not taken, the supervisor was also notified.
Between 5 a.m. and 6 a.m., movement dropped: the worker rested but did not sleep. From then on, beat-to-beat variability increased, a sympathetic component consistent with sleep deprivation, the familiar “hangover” after a sleepless night. At 7 a.m., the end of the shift, the signs of sleep deprivation and extreme fatigue were clear. In this case, the model achieved 95% precision and 78% recall.

Results
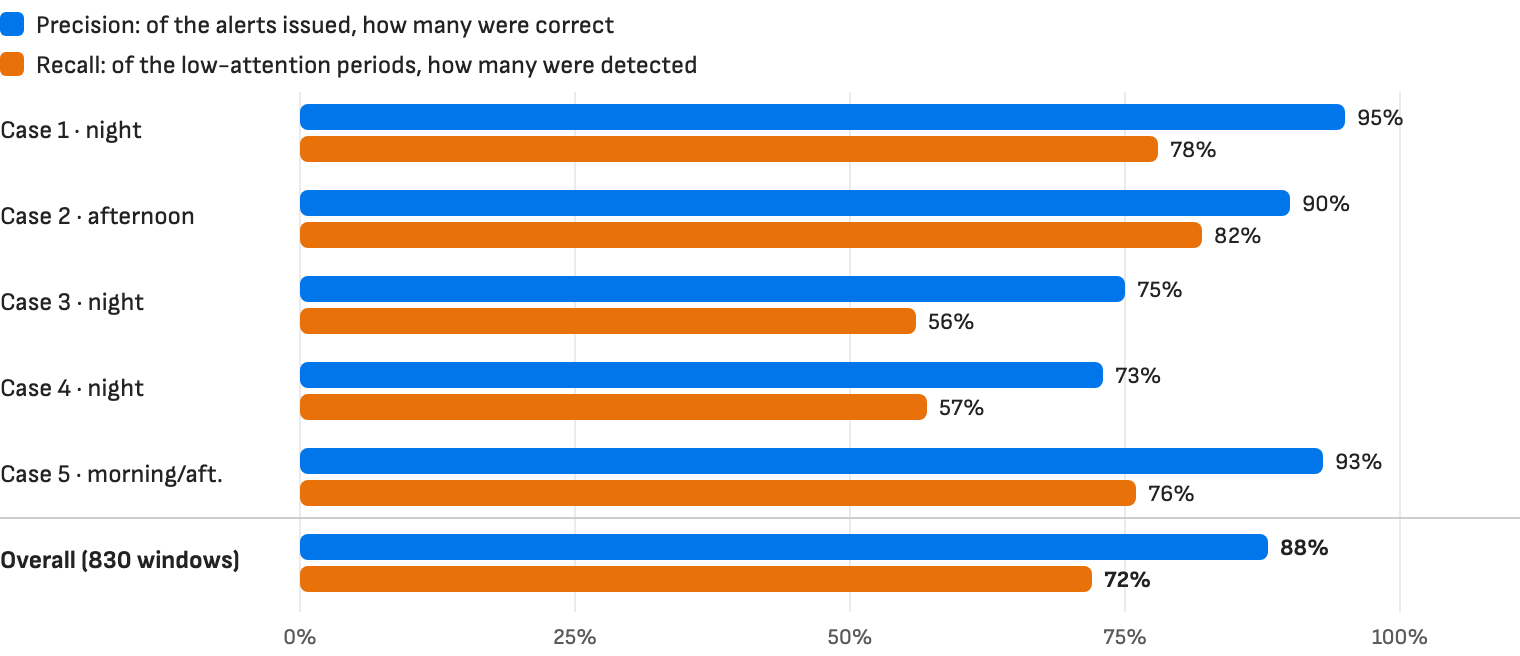
| Shift | Windows | Precision | Recall | Accuracy |
|---|---|---|---|---|
| Case 1 · night | 280 | 95% | 78% | 93% |
| Case 2 · afternoon | 132 | 90% | 82% | 93% |
| Case 3 · night | 132 | 75% | 56% | 92% |
| Case 4 · night | 121 | 73% | 57% | 78% |
| Case 5 · morning and afternoon | 165 | 93% | 76% | 93% |
| Overall | 830 | 88% | 72% | 91% |
In plain terms: out of every 10 alerts issued, about 9 matched real periods of low attention, and out of every 10 periods of low attention, about 7 were detected. Overall, there were 147 correct alerts, 20 false alerts and 57 periods of low attention that went without an alert, across 830 windows.
Cases 3 and 4 performed worse. In Case 3, there were few periods of low attention (16 windows), so each error weighs more. In Case 4, the worker took the sensor off between 2 a.m. and 4 a.m., right during a stretch of falling heart rate.
Limitations and next steps
Part of the errors came from the model’s own response time. Because it uses moving averages, alerts started and ended, on average, 2 to 4 minutes after the moment marked in the labels. This has no relevant operational impact, but it counts as an error in the metrics. The validation was also limited to five shifts in a single job function.
The next steps are to add new biomarkers, adjust the moving averages and study thresholds that vary with the circadian cycle, the shift and the work profile, such as maintenance and logistics.
Since then, the method has remained in use and continued to evolve on the Dersalis platform. Today, managers can adjust alert thresholds per operation, route notifications to different groups and track the effect of interventions, respecting the differences between types of work.
Learn more
- Accumulated fatigue over the shift: detection and prevention
- Drowsy driving: detection and prevention
- BioLink.Ind for industrial operations
- PredictVIEW platform
Revised version of Technical Papers 2 and 3 (2024), prepared by Dersalis in an R&D project with Shell Brasil and Ocyan. Worker data was handled anonymously, in compliance with Brazil’s data protection law (LGPD). Download the PDF.
References
- Armario, A., Labad, J. and Nadal, R. (2020). Focusing attention on biological markers of acute stressor intensity: empirical evidence and limitations. Neuroscience & Biobehavioral Reviews, 111, 95–103. https://doi.org/10.1016/j.neubiorev.2020.01.013
- Burlacu, A., Brinza, C., Brezulianu, A. and Covic, A. (2021). Accurate and early detection of sleepiness, fatigue and stress levels in drivers through heart rate variability parameters: a systematic review. Reviews in Cardiovascular Medicine, 22(3), 845–852. https://doi.org/10.31083/j.rcm2203090
- Gao, R., Yan, H., Duan, J. et al. (2022). Study on the nonfatigue and fatigue states of orchard workers based on electrocardiogram signal analysis. Scientific Reports, 12(1), 1–17. https://doi.org/10.1038/s41598-022-08705-z
- Shaffer, F. and Ginsberg, J. P. (2017). An overview of heart rate variability metrics and norms. Frontiers in Public Health, 5, 258. https://doi.org/10.3389/fpubh.2017.00258
- Sparrow, A. R., LaJambe, C. M. and Van Dongen, H. P. A. (2019). Drowsiness measures for commercial motor vehicle operations. Accident Analysis & Prevention, 126, 146–159. https://doi.org/10.1016/j.aap.2018.04.020
- Task Force of the European Society of Cardiology and the North American Society of Pacing and Electrophysiology (1996). Heart rate variability: standards of measurement, physiological interpretation and clinical use. Circulation, 93(5), 1043–1065. https://doi.org/10.1161/01.CIR.93.5.1043